How to use the QTL meta-plot tool on the QTLdb
Step 0.
![]() Click to choose a species
Click to choose a species
![]() Click Browse to go to the chromosome list
Click Browse to go to the chromosome list
![]() Click to choose a chromosome
Click to choose a chromosome
Step 1.
Seach for a trait with its abbreviation, (e.g. "BW"; see Pointer "1") so that all displayed
QTL are for a single trait, when a Show MetaPlot link will appear
(see Pointer "2").
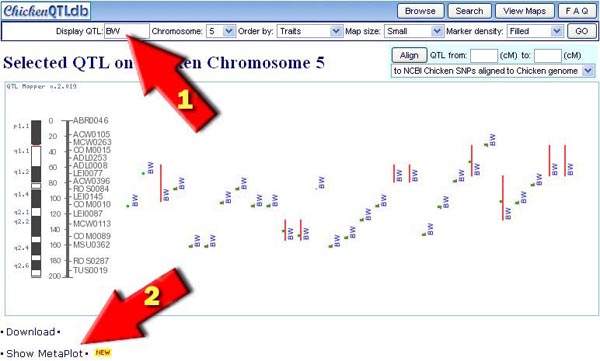
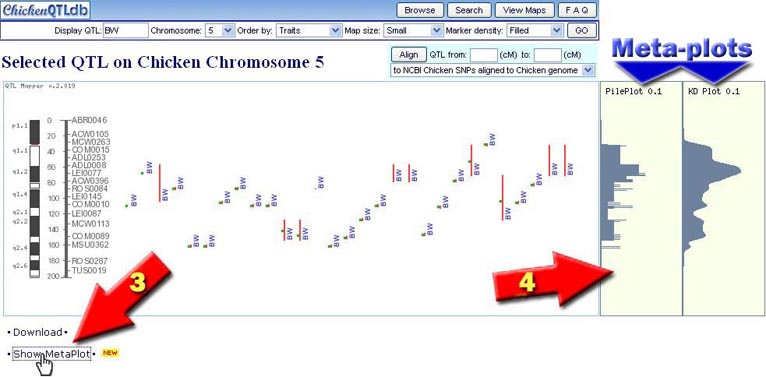
Step 2.
When all QTL displayed on the current window are the same as the result of search, the
Show MetaPlot link will appear (see Pointer "3"). Click on
it, two meta-plots will appear to the right of the QTL graph (see Pointer "4").
One is called "Pile Plot" and the other "KD Plot"
(KD = Kernel Density;
For more information about these meta-plots, please see the reference listed below).
Reference:
Zhi-Liang Hu, Xiao-Lin Wu, Carissa A. Park, and James M. Reecy (2011).
Extension of Animal QTLdb (IV): QTL Meta-analysis On-the-fly (poster). Plant & Animal Genomes XVII Conference, January 14-20, 2011, Town & Country Convention Center, San Diego, CA.